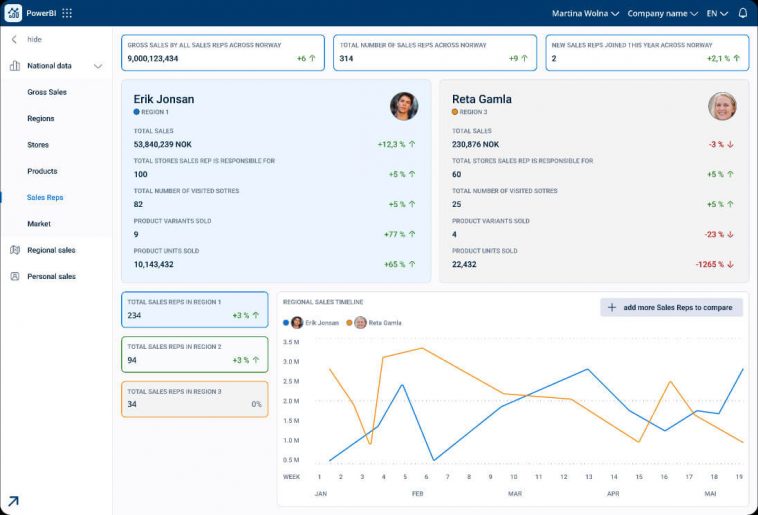
Today, we have to share a well-designed dashboard UI for PowerBI that enables users to effectively analyze and visualize complex data sets with ease, providing valuable insights through interactive charts, graphs, and key performance indicators (KPIs). With its intuitive interface and customizable layout, this UI design empowers businesses to make informed decisions based on real-time data. Many thanks to Martina Wolna for sharing this fantastic Figma freebie!
File Info
- Category: Dashboard
- Download type: Duplicate to Figma


