COVID-19 Data Visualisation Mobile App UI/UX-Free

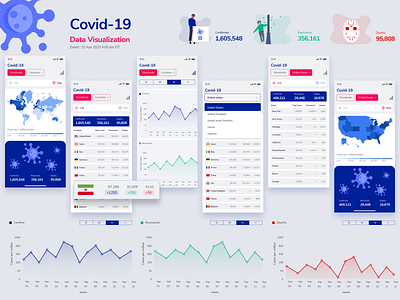


The 2019–20 coronavirus pandemic is an ongoing pandemic of coronavirus disease 2019 (COVID-19), caused by severe acute respiratory syndrome coronavirus 2 (SARS-CoV-2). The outbreak was identified in Wuhan, China, in December 2019, declared to be a Public Health Emergency of International Concern on 30 January 2020, and recognized as a pandemic on 11 March 2020. As of 11 April 2020, more than 1.69 million cases of COVID-19 have been reported in 213 countries and territories, resulting in over 102,000 deaths. More than 376,000 people have recovered. The case fatality rate was estimated to be 4 percent in China, but varies significantly between countries.
The virus is mainly spread between people during close contact, often via small droplets produced during coughing, sneezing, or talking. While these droplets are produced when breathing out, they usually fall to the ground or surfaces rather than being infectious over large distances. People may also become infected by touching a contaminated surface and then their face. The virus can survive on surfaces for up to 72 hours. Coronavirus is most contagious during the first three days after onset of symptoms, although spread may be possible before symptoms appear and in later stages of the disease.
Data Source : Wikipedia


